Shiba inu (SHIB), the world’s second-largest memecoin, has had a rough week. Still, the cryptocurrency appears on track to register a double-digit monthly gain.
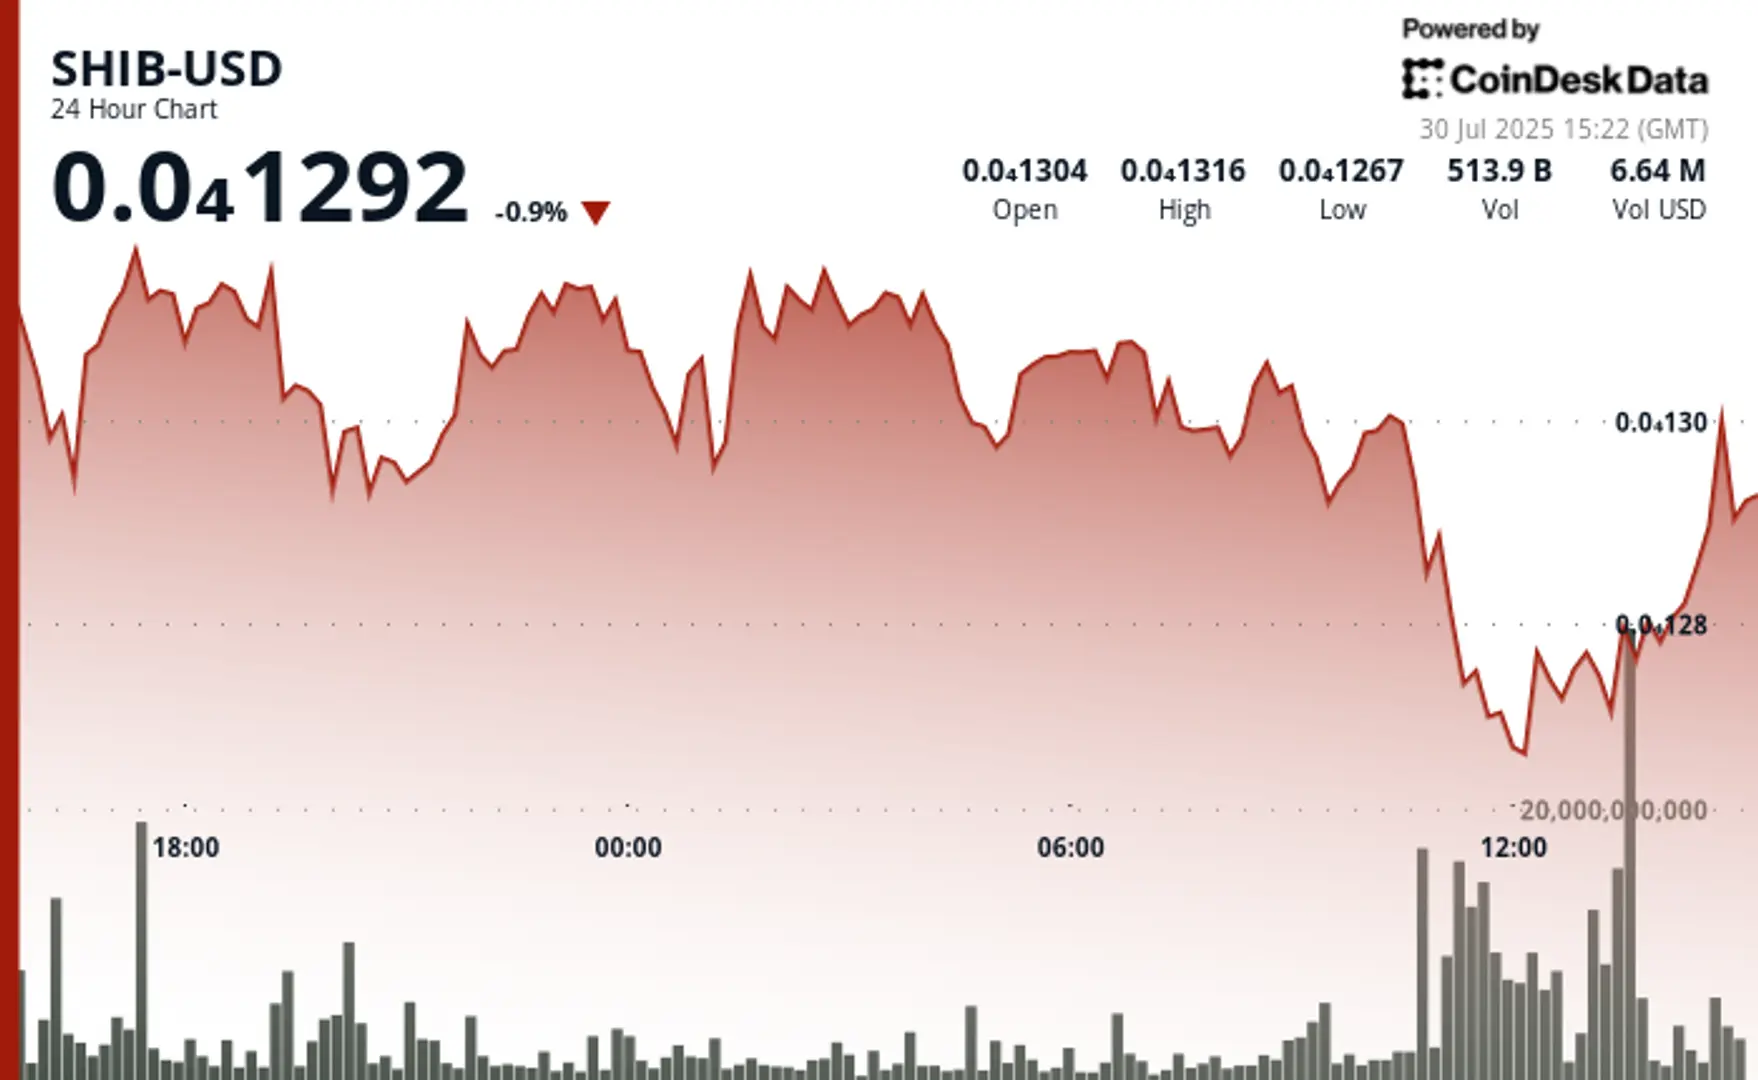
SHIB fell to $0.00001263 early today, the lowest since July 10. Prices are down nearly 9% for the week, with a loss of over 2% in the past 24 hours. The weakness is consistent with the mood seen in the memecoin sector. The CoinDesk Memecoin Index (CDMEME) has declined by 10% in seven days.
Price volatility in SHIB aligns with broader shifts in the crypto market, as policy uncertainty reshapes digital asset allocation. The token’s failure to rally despite aggressive burn programs underscores investor preference for utility-driven projects over pure speculation plays.
Key AI insights
- SHIB plunges 2.28% from $0.000013107 to $0.000012809 during a 24-hour window ending July 30, 14:00
- The burn mechanism destroyed 600 million tokens in a single session, marking a 16,710% surge in destruction rate
- Competitors BONK, PENGU, and utility-driven Remittix capture trader flows as SHIB loses meme coin leadership.
Technical Levels
📖 Related Reading
-
📰 Crypto Daybook Americas: Institutions Pile In Amid ‘High Conviction’ That Prices Will Grind Higher
-
📰 Crypto Daybook Americas: Bitcoin Holds Above $100K as Iran, Israel Trade Blows
- Price dropped 2.28% from $0.000013107 to $0.000012809 across the 24-hour period.
- Trading bandwidth spans $0.0000005215, equivalent to 4.12% of the total range.
- Resistance capped advances at $0.000013184 with rejection during the 17:00 session.
- Support emerged at $0.000012663, backed by 1.25 trillion token volume.
- The downtrend intensified after 10:00 on July 30, with consecutive lower peaks.
- Late-session bounce delivered a 0.25% gain in the final trading hour.
- The volume explosion reached 43.5 billion tokens during the 13:57-13:59 rally phase.
- The three-wave pattern emerged: consolidation, distribution, then short-covering.
Bullish hints
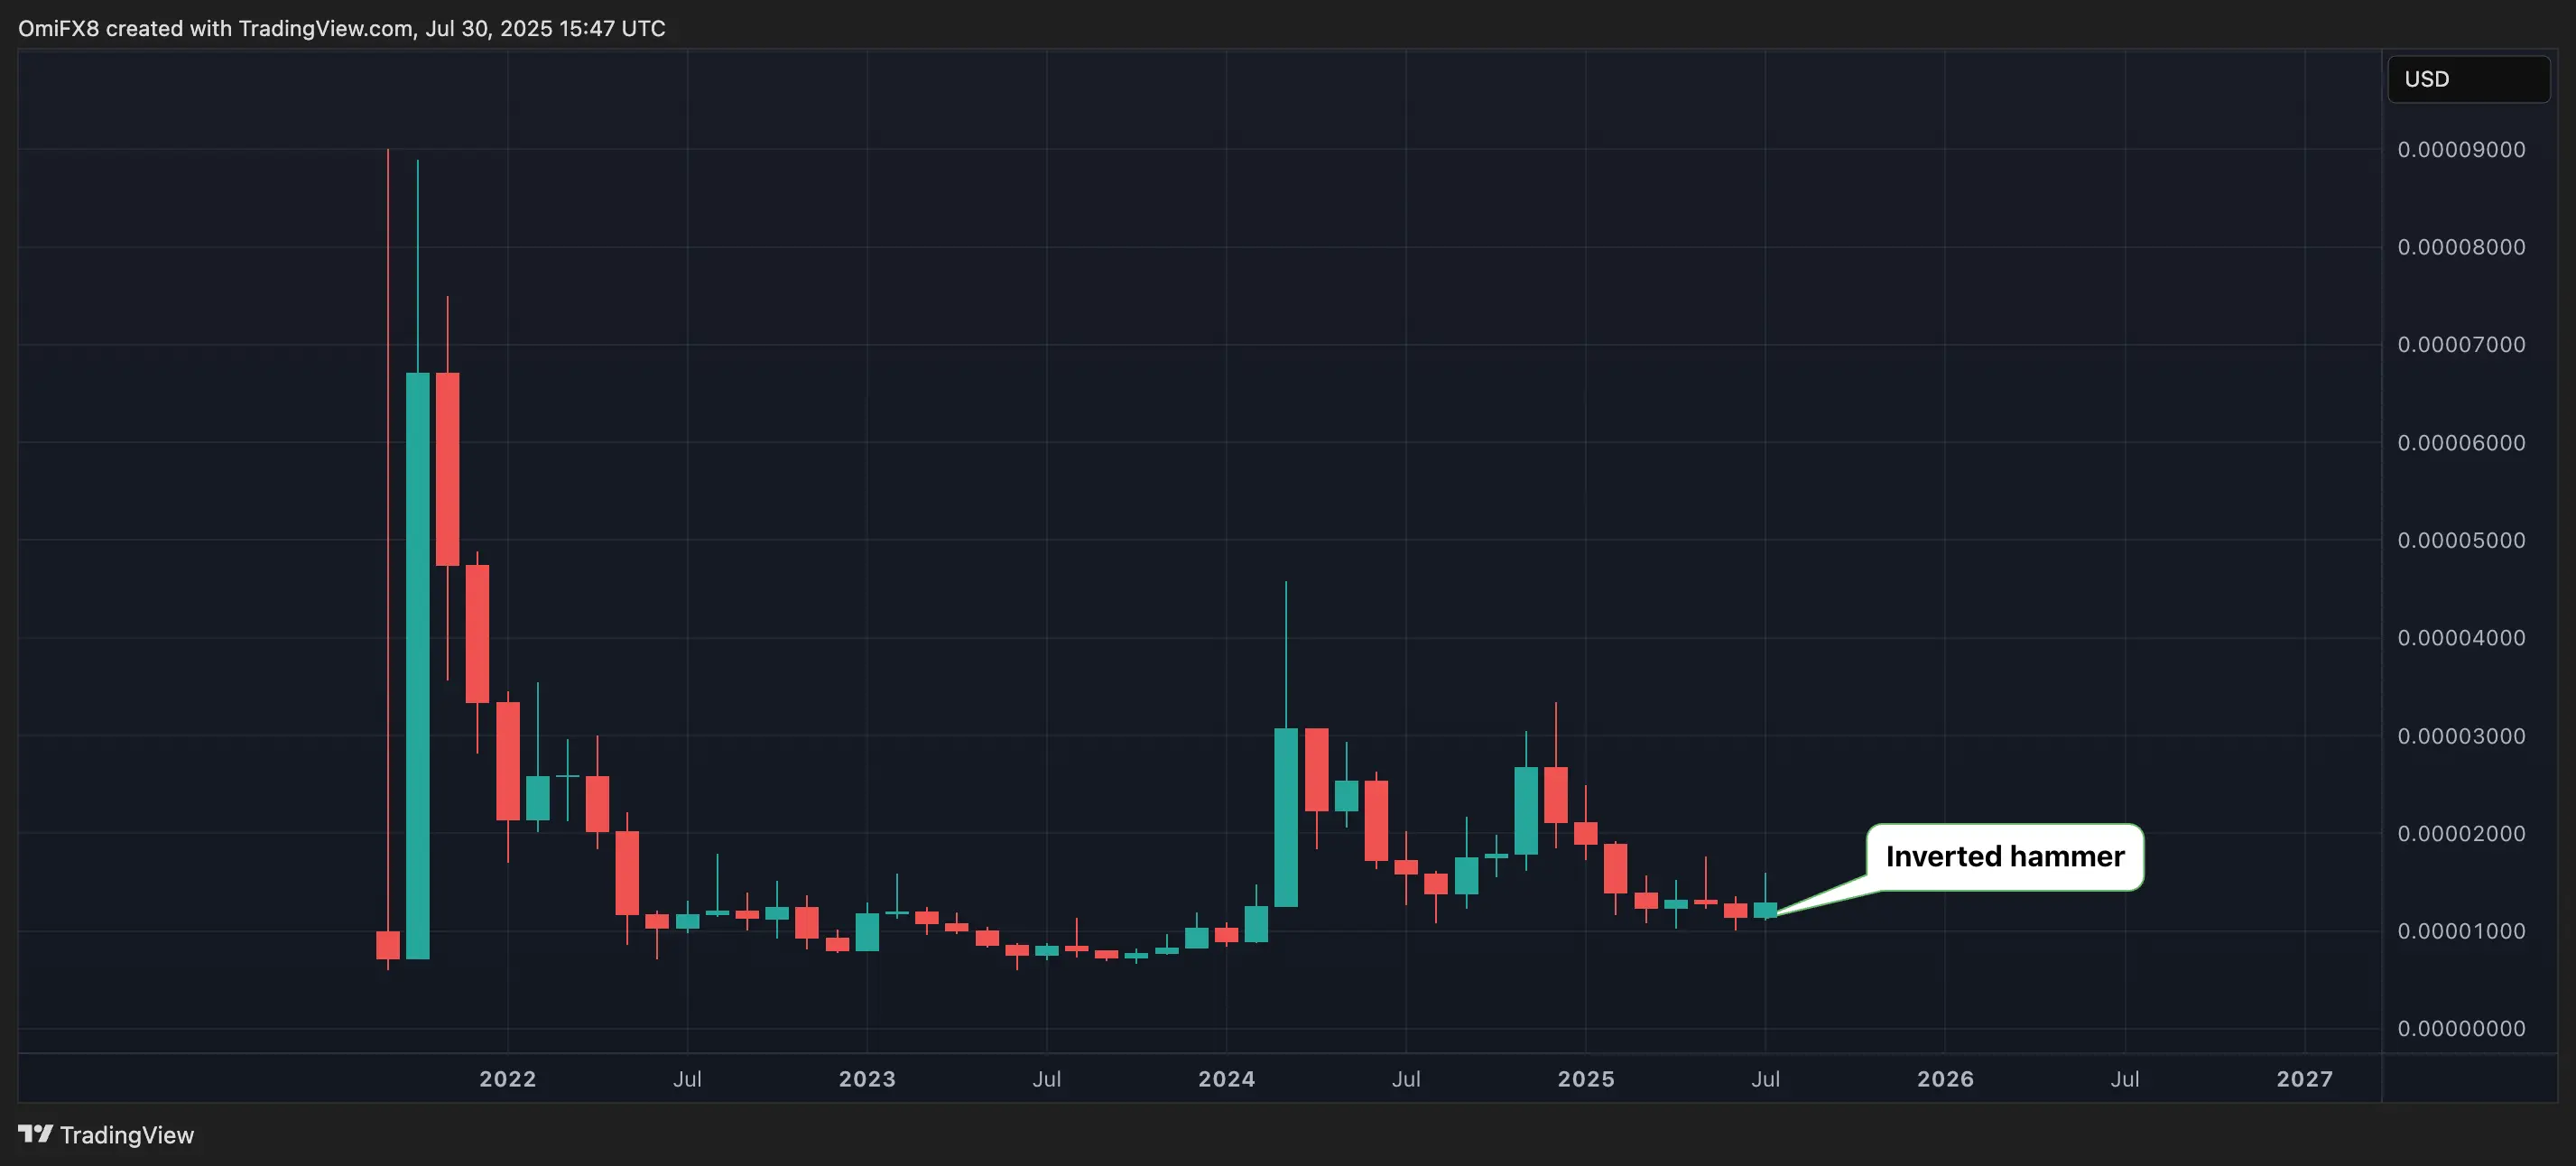
SHIB’s monthly price chart shows the token is likely to end July with an inverted hammer candle as it looks to bounce from year-to-date lows.
An inverted hammering appearing after downtrend or at market lows indicates that buyers attempted to push the price significantly higher during the period, but sellers ultimately overpowered buyers, pushing prices back down to near the opening price.
However, the sheer presence of the long upper shadow indicates that buying interest is re-emerging at these low levels, hinting at potential bullish reversal higher.
Disclaimer: Parts of this article were generated with the assistance from AI tools and reviewed by our editorial team to ensure accuracy and adherence toour standards. For more information, see CoinDesk’s full AI Policy.
🔗 You Might Also Be Interested In
Crypto Daybook Americas: Institutions Pile In Amid ‘High Conviction’ That Prices Will Grind Higher
Crypto Daybook Americas: Bitcoin Holds Above $100K as Iran, Israel Trade Blows
The Protocol: Ethereum Validator Exit Queue Backs Up
💡 Stay updated with the latest cryptocurrency news and insights by following our website! 🔔 Bookmark this site to get first-hand blockchain and digital currency news!